Anything I.T. and the Geek Collective provide an I.T. Support service and Website design to business clients in Plymouth, South West of the UK.
What is Google Analytics?
Google Analytics is a system created by Google to help website owners with statistical information about their website.
Do you remember the old website hit counters? They used to be pretty much the only way you could tell how popular your website was!

Google devised a system where a large amount of useful statistical data could be gathered about your website and it’s visitors. From the total number of visitors during a given period to the kind of device the user was visiting your website on. Google Analytics also shows you information about where the visitor is viewing your website from and how long they stayed on your site.
How it works
One basic requirement is for some Google code to be inserted into your website. If you have access to the website HTML files, then some code like this would need to be placed just before the </head> tag:
<script>
  (function(i,s,o,g,r,a,m){i['GoogleAnalyticsObject']=r;i[r]=i[r]||function(){
  (i[r].q=i[r].q||[]).push(arguments)},i[r].l=1*new Date();a=s.createElement(o),
  m=s.getElementsByTagName(o)[0];a.async=1;a.src=g;m.parentNode.insertBefore(a,m)
  })(window,document,'script','//www.google-analytics.com/analytics.js','ga');

  ga('create', 'UA-yoursiteID', 'yourdomainname.co.uk');
  ga('send', 'pageview');

</script>
The code you need to insert is provided by Google in your Analytics Dashboard when you set up your site.
If your site is built with WordPress, then there are plugins you can install that will do this for you. You would need to install the plugin and the plugin would ask you to connect to Google Analytics so that it can create the necessary code for you.
Essentially, every time a user visits your website, the code above is run and Google receives the information about the visit. This information is then shown in your Dashboard.
Explanation of the most useful features
After navigating to your website dashboard within Google Analytics, you should see information similar to the following. This is the Overview of your site and usually displays the main information from the last seven days.
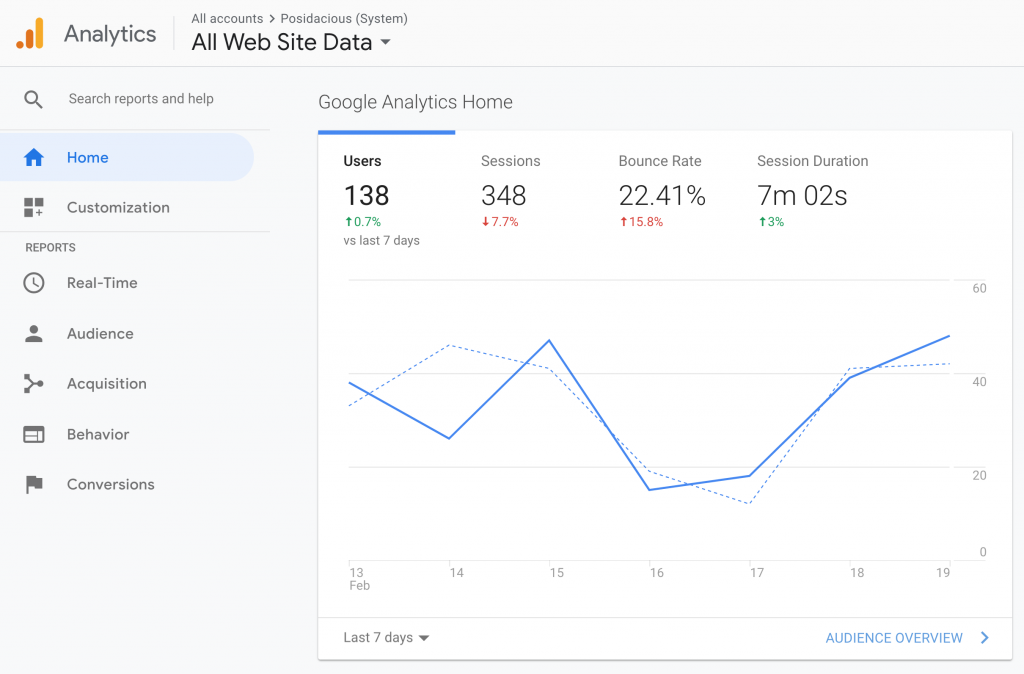
In the screenshot above, you can see four main pieces of data:
Users
This is the number of unique users who have visited the website. This is possible one of the best pieces of information since it tells you how many actual people have visited your website.
Sessions
Sessions are the total number of times the site has been visited. Sessions could be made by Users visiting the site several times. In the example above, you can see there are more sessions than users. This suggests that some users have visited the site more than once during the period specified.
Bounce Rate
Bounce rate is where a visitor lands on your site but then departs without clicking through to other pages. In other words, they see one page then either go back (perhaps to search results) or close the browser, ending the sessions
Session Duration
Session duration tells you how long in hours:minutes:seconds the visitor stayed on the site.
Audience
One of the main areas I look at is Audience. Or Audience Overview. This shows you a graphical image of the time period selected. The time period can be changed in the top right of the page. You can also compare to previous years by selecting ‘Compare to:‘ in the date range selector.
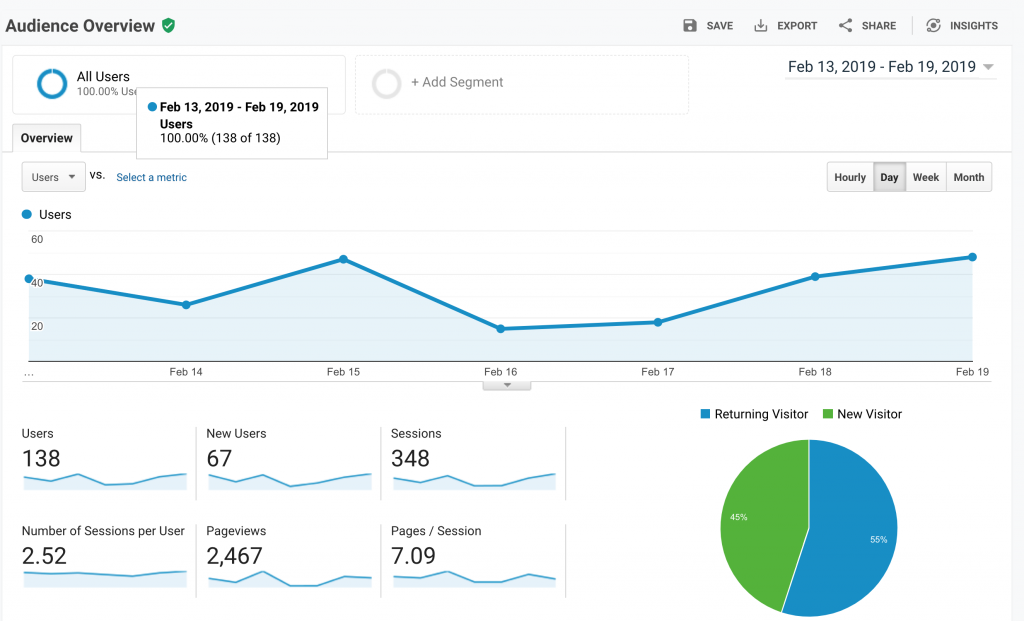
Here, we have some additional information. You may notice ‘New Users‘ and ‘Pageviews‘.
New Users
New users are visitors to the site that have not visited previously. If a visitor has been to your site in the past, then they would simply be a ‘User’.
Pageviews
This is the number of pages that your site visitors have seen. For instance, every time someone clicks on your About Us page, that is recorded as a Pageview.
Analysing the data presented
How it works for your business is of utmost importance to using Google Analytics.
If you can look at the data and make useful, informed decisions about your website, then Google Analytics has done its job. Try and look at the data in such a way that you can gain meaningful information to take your business forward.
So, it’s really up to you how it can work for your business. In the examples and screenshots below, I suggest some areas that we could look into to make the website shown a better one.
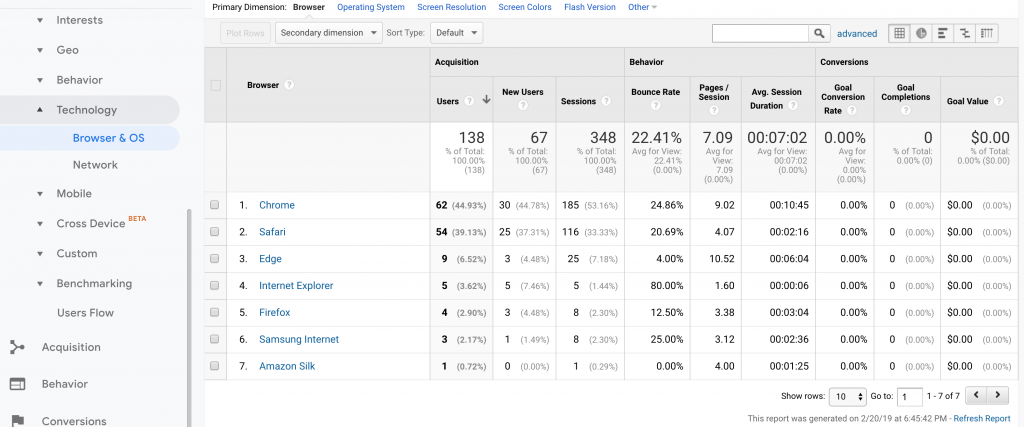
Example 1: Browser
In the screenshot below we can see a list of browsers that people have used to visit the website. Top of the list is Google Chrome, Safari, Edge, and so on.
From a business perspective, there are two or three interesting pieces of data:
- Session duration difference between Chrome and Safari. 8 minutes! Why is that? We need to ask questions about this. It could be that Safari in this list refers to the mobile version of Safari as well as the Desktop version. Perhaps mobile users don’t spend so much time on the site?
- The Internet Explorer Bounce Rate. Internet Explorer is the old browser by Microsoft and is no longer supported. But why would users of this browser be more likely to leave the site after visiting one page? Granted, there were only five users. Perhaps you could make a business decision to display a message on your site to Internet Explorer users saying that the website works best on Chrome/Edge/Safari/Firefox?
- Three users visited the site using the built-in browser in their Samsung device (Samsung Internet), and another used Amazon Silk (Kindle/Fire browser)!
Example 2: Mobile vs Desktop
In this screenshot, you can see something incredible. Visitors to the site are doing so on a mobile device MORE than on a desktop computer!
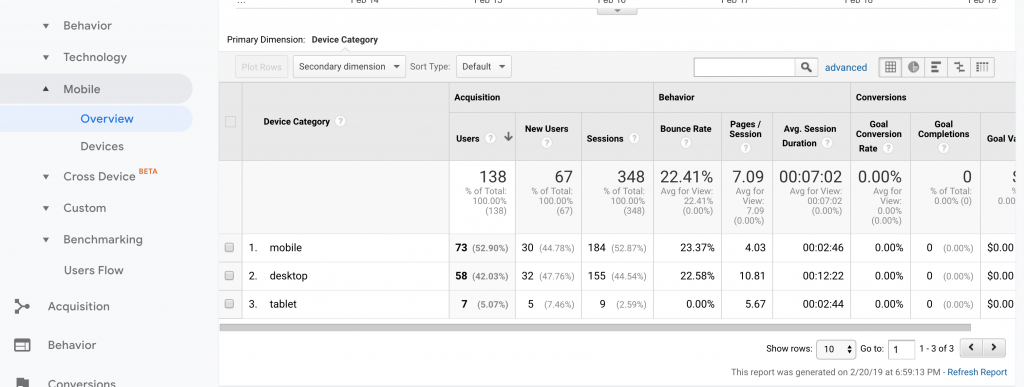
What does this tell you and your business? Well, the owner of this site certainly needs to ensure that the site works well when viewed on a mobile device! It needs to look good and load fast!
Acquisition
I’ll finish this short explanation by talking about Acquisition. This is data showing where your visitors came from to get to your site. For instance, this is extremely useful if you want to analyse keywords that users type in on Google Search
This data also shows whether the user types the address of your website in manually, or perhaps have clicked a link on another website.
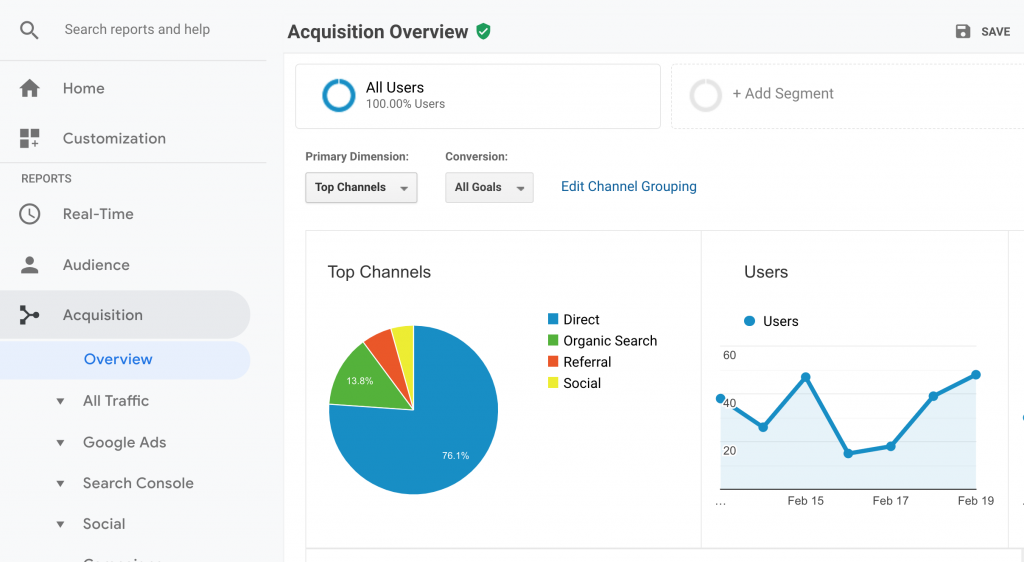
So for this website, the majority of users appear to be ‘Direct’ visitors. This is where the user has either typed the address of the website into the URL bar in the browser or has perhaps saved the website to their favourites.
This data is not entirely surprising for this site (Posidacious) since it is a Maintenance Management System for letting agents and landlords. Therefore, I should imagine a lot of the tenants will have saved the page somewhere, as would the staff of the agencies and their contractors.
A small percentage find the site by searching or via social media.
A short video by Anything I.T.
Here, we show you around some of the features in a short video
Further reading
Neil Patel is probably my favourite online marketer. He dishes out free advice almost daily and writes comprehensive helpful blogs on various SEO related topics.
He has written a blog post called: How to Get Actionable Data from Google Analytics in 10 Minutes, which goes into more detail and in fact he goes on to explain how to set up Goals within Google Analytics. A very useful feature.